


Project quality is the silent force in project management, often overshadowed by the loud demands of time and budget, yet capable of derailing success just as swiftly.
While deadlines and costs dominate the spotlight, neglecting quality can quietly undermine a project, leading to costly rework, unhappy stakeholders, or outright failure. Complicating matters further, quality standards are rarely set in stone; they can be elusive, shifting with stakeholder expectations and project nuances.
Recognizing this, the Project Management Institute (PMI) places project quality planning at the forefront of its three-step approach to effective quality management, followed by Quality Assurance and Quality Control. By prioritizing planning, project managers can proactively define, measure, and achieve excellence—ensuring quality doesn’t just linger in the background, but becomes a cornerstone of success.
The Project Quality Management Plan
The Quality Management Plan, which is a component of the overall Project Management Plan. This plan identifies what the project quality standards are, how they will be met, and how they will be measured.
The three primary components of a quality management plan are:
- Quality Standards. Most industries have quality standards that can be taken ‘off the shelf’ and used for the project. Organizations such as ASTM, IEEE, or ANSI exist solely to develop standards for you, their customer, to use as a measuring stick for your project quality. These types of organizations can provide a tremendous competitive advantage when utilized effectively.
- Quality Measurement. How will adherence to those standards be measured? Sometimes it’s obvious, but other times significant room for debate exists, like when a newly paved road has a few small cracks in it. These measurement techniques should be outlined in the project management plan, up front.
- Inspection. When the project quality will be inspected, what things will be recorded, and what types of data will be communicated are important variables to consider in the project management plan.
Quality Control vs. Quality Assurance
The Quality Management Plan identifies the methods used to ensure the quality of the products meet the quality specifications. It does this in two ways:
- Quality Control measures a portion of the outputs to determine conformance to specifications.
- Quality Assurance measures the processes used to attain the quality standards.
Cost-Benefit Analysis
Quality impacts the bottom line. Each project deliverable provides a benefit to the customer and comes with an associated cost. Analyzing both sides of this equation can lead to reduction or even elimination of unnecessary deliverables.
Cost of Quality
When an earlier project deliverable is produced with low quality, future deliverables will almost always continue with the quality issues.
According to the PMI, the cost of quality includes all costs incurred over the life of the project or product by investment in preventing non-conformance to requirements, appraising the product or service for conformance to requirements, and failing to meet requirements (rework).
Cost of Conformance
- Training
- Document processes
- Equipment
- Time to do it right
- Testing
- Destructive testing loss
- Inspections
Cost of Non-conformance
- Rework
- Scrap
- Liabilities
- Warranty work
- Lost business
Control Charts
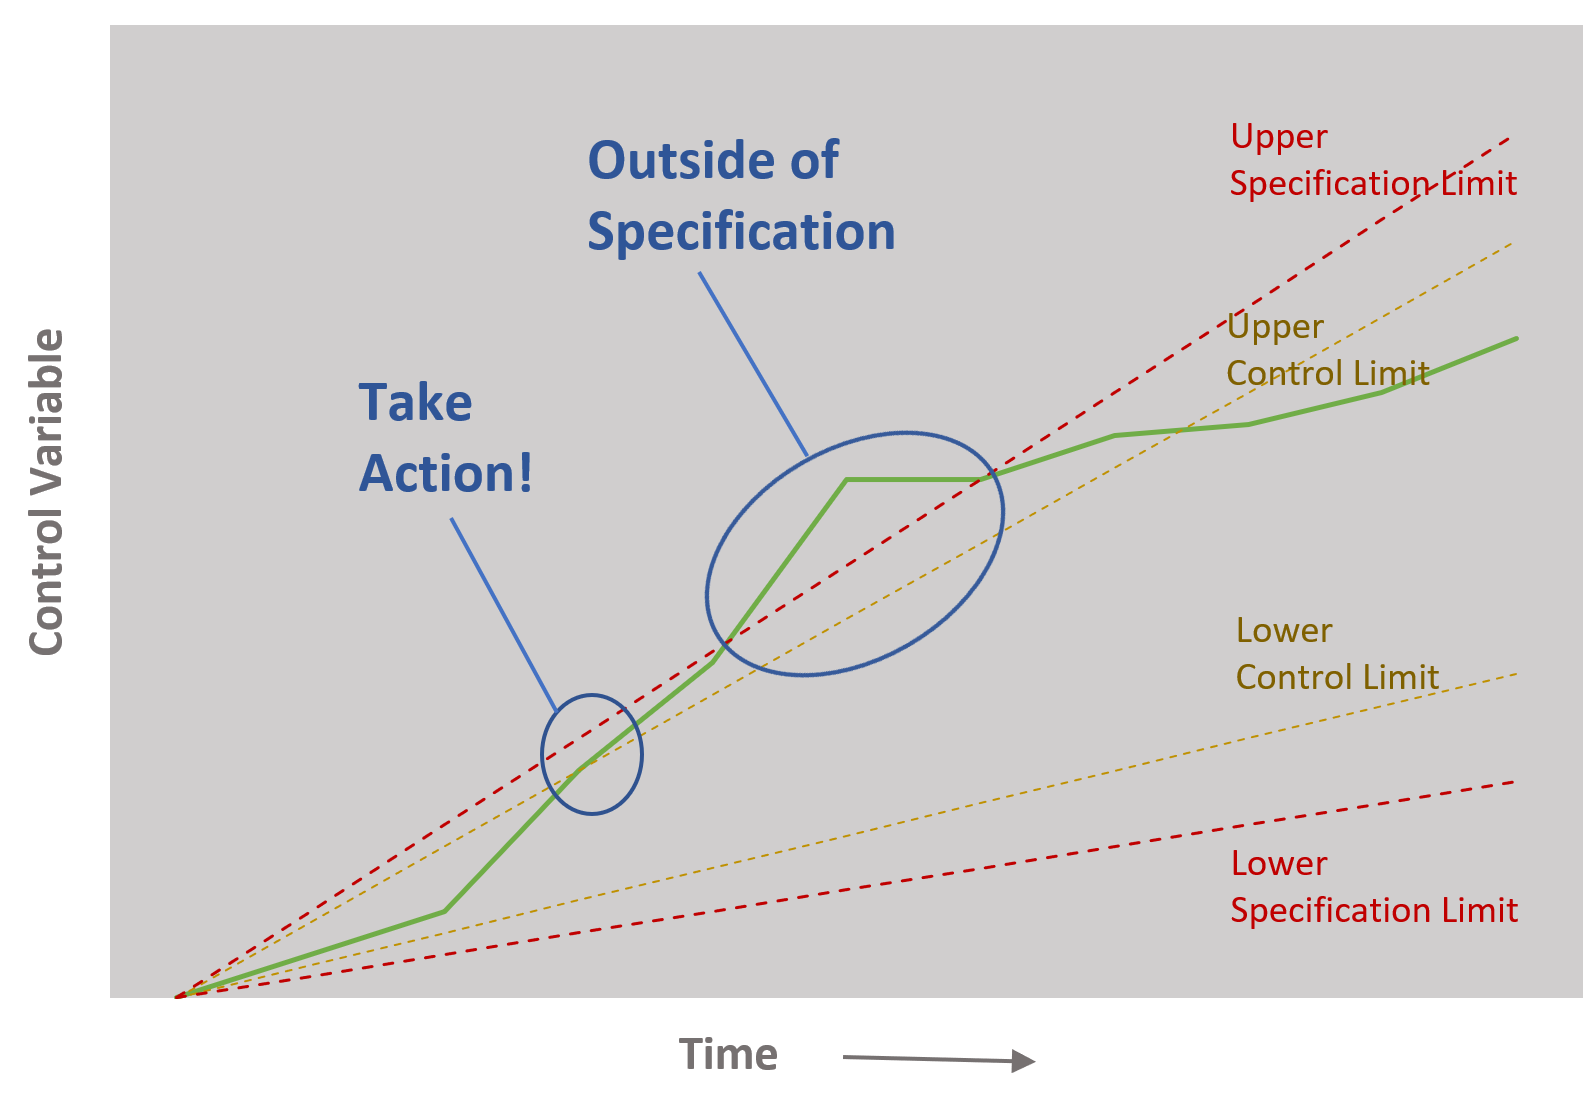 Control charts define the point at which action needs to be taken to ensure a variable remains within specifications.
- The Upper Specification Limit (USL) defines the upper tolerance of acceptable results.
- The Lower Specification Limit (LSL) defines the lower tolerance of acceptable results.
- The Upper Control Limit (UCL) defines the point at which the results are flagged for a specific action.
- The Lower Control Limit (LCL) defines the point at which the results are flagged for a specific action.
The difference is that specifications tend to be external pass/fail criteria versus control limits which represent an action the project management team identifies as a point in which some type of action should be taken.
For example, you could monitor project hours with a control chart that has time on the x-axis and hours spent on the y-axis. At the project outset five lines are drawn. The first is the planned hours worked, the second and third are the upper and lower control limits, and the fourth and fifth are the specification limits. The control limits are the point at which the project manager has determined that some type of action will be taken to correct the variance, and the specification limits are the point at which the project is outside the specifications of the project.
Benchmarking
Benchmarking involves the comparison of actual or planned project practice with those of comparable projects to identify best practices, generate ideas for improvement, and provide a basis for measuring performance.
Design of Experiments
This is a statistical method which identifies factors which may influence specific variables of a product or process under development or in production. For example, automotive designers could use this technique to determine which combination of tires and suspension will product the most desirable ride characteristics.
Statistical Sampling
Statistical sampling involves choosing a part of a project deliverable set for inspection, for example, choosing 10 engineering drawings out of 75 for an inspection for certain quality criteria.
Flowcharting
A flowchart of the project schedule can be a great way to show the relationships between various project steps and can be an invaluable tool to find project quality issues. They can help the project team anticipate quality problems.
Proprietary Quality Management Methodologies
Many proprietary methods for managing project quality exist, including Six Sigma, Quality Function Deployment, CMMI, Total Quality Management, Balanced Scorecard, etc.
Brainstorming
Sometimes, getting the project team together and brainstorming for potential quality problems is the best way to ensure a high quality outcome.
Affinity Diagrams
These are a great tool to visually identify logical groupings based on natural relationships. They can draw out the potential quality issues in a snap.
Force Field Analysis
Diagrams of the forces for and against change. Before any project changes occur, this is an interesting way to make sure that quality remains high throughout.


Leave a Reply