 Earned value results are very easy to report to senior management or other stakeholders. Generally the recipient needs some basic training regarding the meaning of the numbers, but this is not a major undertaking. A simple definition list with each metric would normally suffice.
Small Projects
For small projects that last about 3 weeks or less, a simple earned value table that includes the cost and schedule variances could meet the reporting requirements:
| Project Status Report | |
|---|---|
| Date | March 3 |
| Project Budget | $10,000 |
| Schedule Variance | -$1,000 |
| Cost Variance | -$2,500 |
| Comments | A one time purchase of materials has created the negative variances |
This could be done daily to weekly and provides management with an excellent indicator of the project’s status. It is also not particularly onerous. All it takes is assembling the actual cost data and assigning a percent complete to each task, followed by 30 seconds worth of calculations.
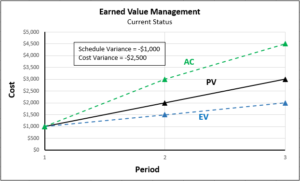
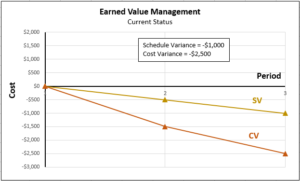
Another helpful chart for small projects involves the graphing of the cost and schedule variance over time (period by period). At each status point the data table is given one more column, and the results are graphed to show the trends in the variances over time. The data table looks like this:
| Period | Inputs | Schedule | Cost | ||||
|---|---|---|---|---|---|---|---|
| PV | EV | AC | SV | SPI | CV | CPI | |
| 1 | $1,000 | $1,000 | $1,000 | $0 | 1.0 | $0 | 1.0 |
| 2 | $2,000 | $1,500 | $3,000 | -$500 | 0.90 | -$1,500 | 0.85 |
| 3 | $3,000 | $2,000 | $4,500 | -$1,000 | 0.67 | -$2,500 | 0.44 |
| 4 | $4,000 | ||||||
This is an excellent way to see the bigger picture and get a grasp of project performance issues that the one time snapshot doesn’t give you. For example, if the SPI had gone down very quickly but was now trending upward, maybe this is less concerning than an SPI that isn’t as bad right now but is trending downward.
On this chart a positive situation would be where the EV is above the PV and the AC is below. Thus, in this example they are both trending negative.
Medium Sized Projects
For projects that last between about 3 weeks to 6 months, a status report that indicates efficiency levels and projected completion dates and budgets is more helpful.
| ID | Name | Start | End | BAC | PV | EV | AC | SV | SPI | CV | CPI | ETC | EAC | VAC | TCPI |
|---|---|---|---|---|---|---|---|---|---|---|---|---|---|---|---|
| 100 | Set up Database | Mar. 1 | Mar. 10 | $10,000 | |||||||||||
| 110 | Acquire Server | Mar. 1 | Mar. 2 | $1,500 | |||||||||||
| 120 | Set up Data Structure | Mar. 3 | Mar. 3 | $1,000 | |||||||||||
| 130 | Move Data | Mar. 4 | Mar. 10 | $7,500 | |||||||||||
| 200 | Build Application | Mar. 7 | Mar. 20 | $15,000 | |||||||||||
| TOTAL | $35,000 | ||||||||||||||
Notice that the 100-level tasks are summary tasks (phases) and the 110-level tasks are the individual project activities. You could also report the metrics by phase, at the 100-level only.
The period by period view is slightly more involved. A spreadsheet might be necessary because of the many periods that will be involved. The data table might look similar to this:
| Period 1 | Period 2 | Period 3 | Period 4 | Period 5 | |
|---|---|---|---|---|---|
| BAC | |||||
| PV | |||||
| EV | |||||
| AC | |||||
| SV | |||||
| SPI | |||||
| CV | |||||
| CPI | |||||
| ETC | |||||
| VAC | |||||
| TCPI | |||||
| EAC |
Senior management generally favor the forecast values (ETC, EAC, VAC, and TCPI) whereas stakeholders favor the current project status (SV, SPI, CV, and CPI).
Large Projects
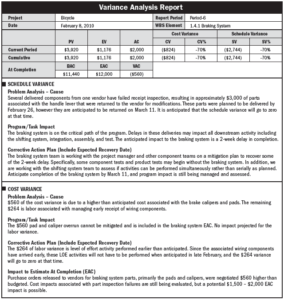
On large projects which last more than about 6 months the reporting requirements would be similar to medium sized projects, but with a few additions. Each task is probably of a size that demands more information on a task by task basis. In addition to the project status report which contains the above earned value metrics, a task status report could be filled out which contains the following information:
- The earned value metrics for the task: BAC, PV, EV, AC, SV, SPI, CV, CPI, ETC, VAC, TCPI, and EAC.
- The current status of the task.
- Work that has been completed to date
- Schedule for work during the next status period
- Cost Variance
- Cause of variance
- Impact on project budget
- Corrective action plan, if applicable
- Schedule Variance
- Cause of variance
- Impact on project budget
- Corrective action plan, if applicable
Alternatively, a form like this can be reserved for variances that are beyond a certain threshold, say 20%. This example has been taken from the PMI Practice Standard for Earned Value Management, 2nd Edition:
For large projects we recommend the project management team be familiar with the reporting options outlined within the Practice Standard for Earned Value Management, by the Project Management Institute. There are a myriad of ways the project’s progress, status, and forecast can be reported. A strategy needs to be determined based on the needs of management and other project stakeholders. Project specific forms can be developed, if necessary. The project management plan, in the stakeholder communication section, should contain the details of how and when the reporting will take place.
Congratulations! This concludes the ‘teaching’ portion of the tutorial. On the next page we will work through a complete example, from A to Z (well, technically, BAC to TCPI). All the numbers are calculated for you and we show you how it’s done. Good luck.
Navigation
- Previous Page: Earned Value Forecasting
- Next Page: Earned Value Example
- Home: Earned Value Tutorial


